Download the sample data: stocks.csv. This contains stock market data with prices, volumes, and financial metrics for major tech companies.
Create Your Project
First, let’s create a dedicated project for your data analytics.1
Access the Infactory Workshop
Navigate to the Infactory Workshop:You’ll see the Infactory Workshop homepage with your projects.
2
Start a New Project
Click the “New Project” button in the top right corner.
3
Name Your Project
In the dialog that appears:
- Project Name: Enter
Stock Market Analytics - Leave other settings as default
Choosing a descriptive name like “Stock Market Analytics” or “Financial Analysis” helps Infactory’s AI understand your data context and generate better query suggestions.
4
Create project
Click “Create project” to initialize your workspace.
Success! You now have a dedicated project workspace. You’ll see your empty project dashboard.
Connect Your Data Source
Now let’s add your stock market data to the project.
1
Add a Data Source
Click the ”+” button in the Connect panel on the left sidebar to add a new data source.
2
Select Connection Type
In the “Add Data Source” dialog:
- Select “Upload Files” from the connection types
- Click the upload area or drag and drop
stocks.csv
- File:
stocks.csv(8.5 KB) - Data Source Name: Auto-populated as
StocksCsv - Description: Empty text field with placeholder
The upload interface shows your file with auto-populated name and description fields
-
Data Source Name: Replace the auto-generated name with:
-
Description: Add this detailed description:
- Click “Upload 1 File” to proceed.
You can upload multiple files at once using the “Add More Files” button if you have related datasets.
3
Schema Generation
After clicking “Upload 1 File”, Infactory automatically generates a schema for your data: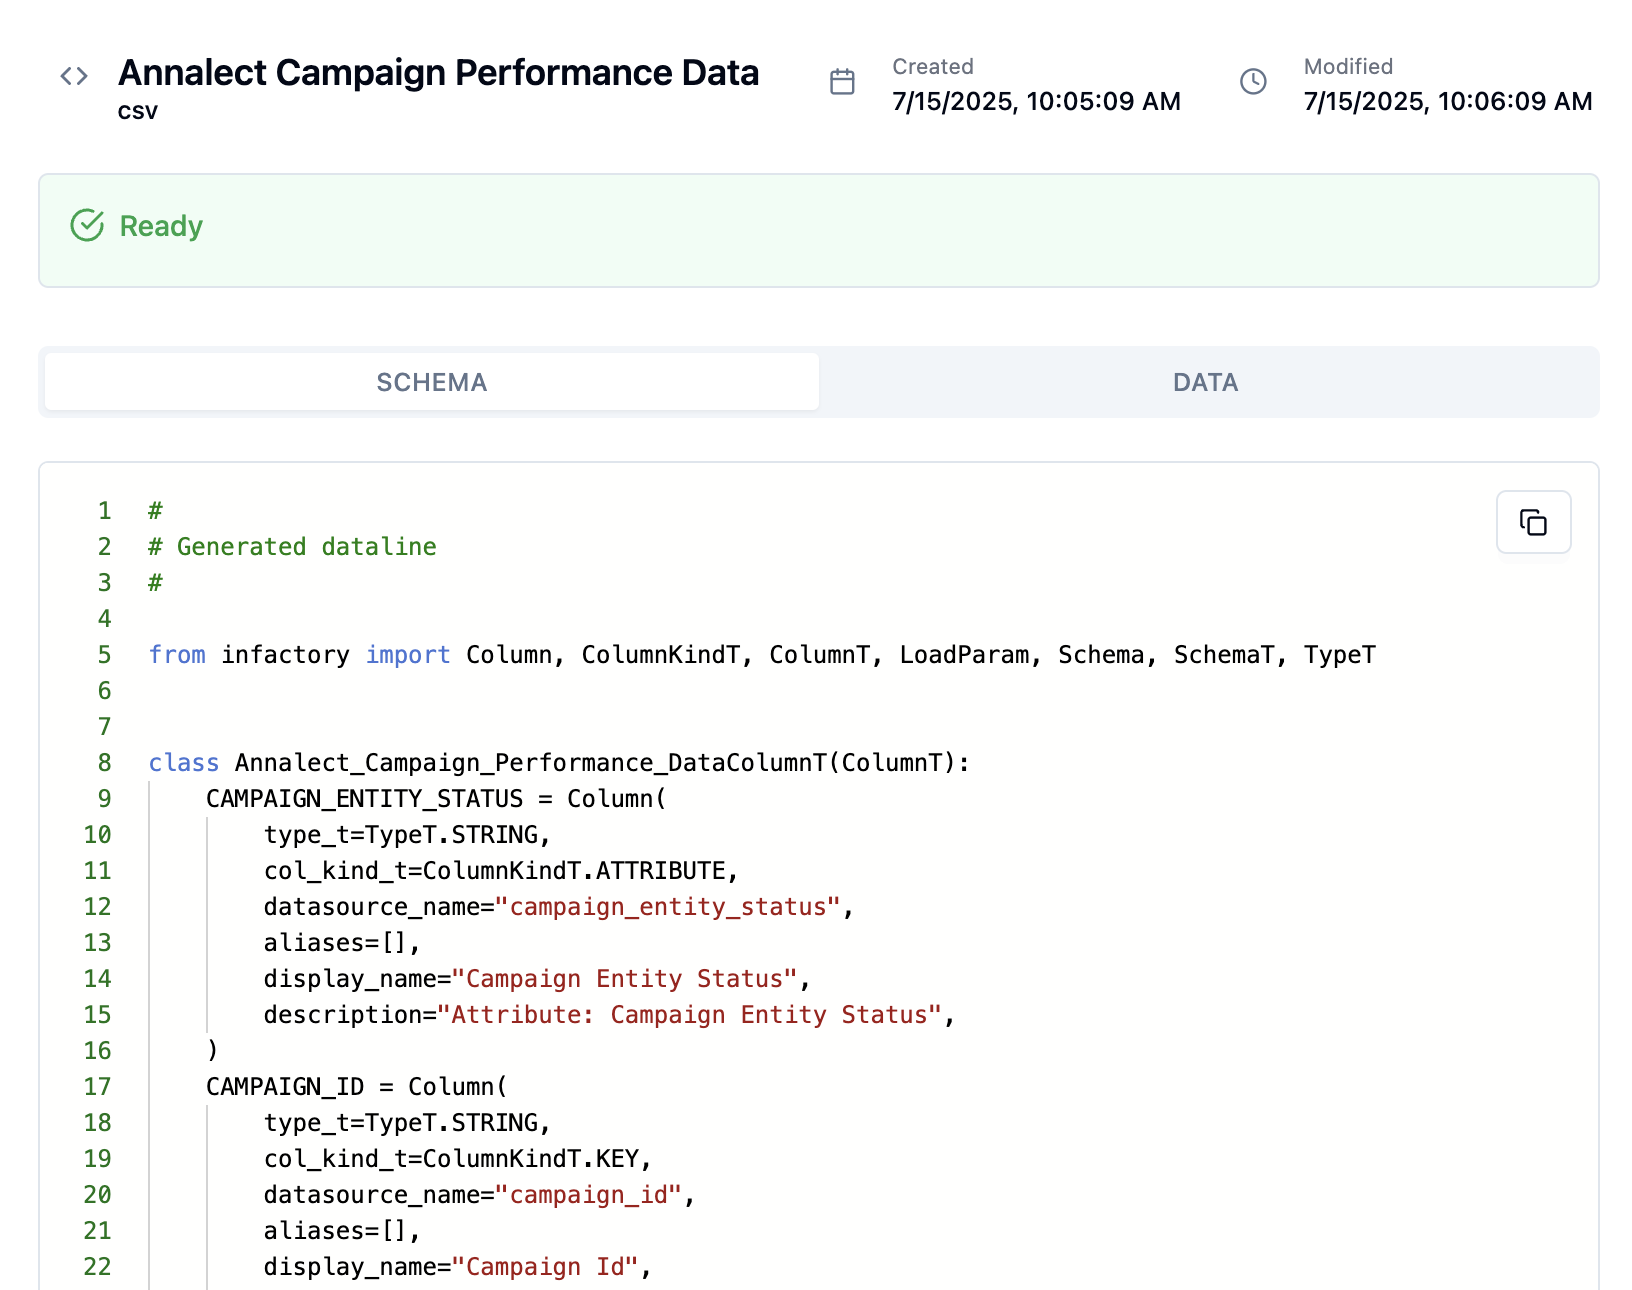
AI-generated schema showing column definitions and relationships
- Column definitions with appropriate data types
- Display names that are human-readable
- Descriptions for each field based on content analysis
- Relationships between different columns
The schema generation uses AI to understand your data context. Because you provided a descriptive name and description earlier, the AI can better identify column purposes and relationships.
4
Success! Schema Complete
Once the schema generation is complete, you’ll see:The system has:
- ✅ “Ready”
- 📊 Schema with 16 columns generated
- 🔍 Ready to build query programs
Congratulations! Your stock market data is now connected and ready for analysis.
- Analyzed all 16 columns
- Generated appropriate data types and descriptions
- Indexed your data for fast querying
- Prepared the AI to understand your data context
What Just Happened?
Behind the scenes, the Workshop:- Parsed your CSV file and detected data types
- Generated a schema using AI to understand each column’s purpose
- Indexed the data for fast querying
- Used your descriptions to enhance the schema with business context
- Prepared it for AI-powered analysis
- Made it queryable through natural language
- Automatically identified column types (STRING, FLOAT, etc.)
- Determined which columns are keys vs. variables
- Created human-readable display names
- Generated contextual descriptions for each field
- Better understand your data’s business context
- Generate more accurate column descriptions
- Create more relevant query suggestions later
- Build better API endpoint names when deploying
Troubleshooting
Upload fails or times out
Upload fails or times out
- Check your internet connection
- Ensure the file is under 500MB
- Try refreshing and uploading again
- Contact support if the issue persists
Schema generation taking too long
Schema generation taking too long
- Normal generation time is 10-15 seconds
- For large files, it may take up to 30 seconds
- If it exceeds 1 minute, refresh and try again
Wrong data types detected
Wrong data types detected
- The AI makes intelligent guesses based on your data
- You can adjust column types later if needed
- Descriptive data source names help improve accuracy
What’s Next?
Your data is connected and ready! Now let’s create Infactory Intelligent Queries to analyze your stock market data.Continue to Build Queries
Learn how to create Infactory Intelligent Queries using natural language →
Time Check: You should be about 2 minutes into the tutorial. Everything working smoothly? Great! If not, reach out to [email protected] for immediate help.