The Explore section provides a chatbot-like interface that understands your data and automatically creates charts and tables based on your questions.
Interactive Data Explorer
The Explore section lets you ask natural language questions about your data and see instant visualizations.Access the Explore Interface
1
Open the Explore Interface
Start exploring your data:
- Look for the “Explore” section in the left sidebar
- Click the ”+” button next to “Explore”
- A chatbot-like interface opens with “Explore your data” prompt
Explore interface ready for natural language questions
2
Ask Your First Question
Let’s see your stock market data visualized: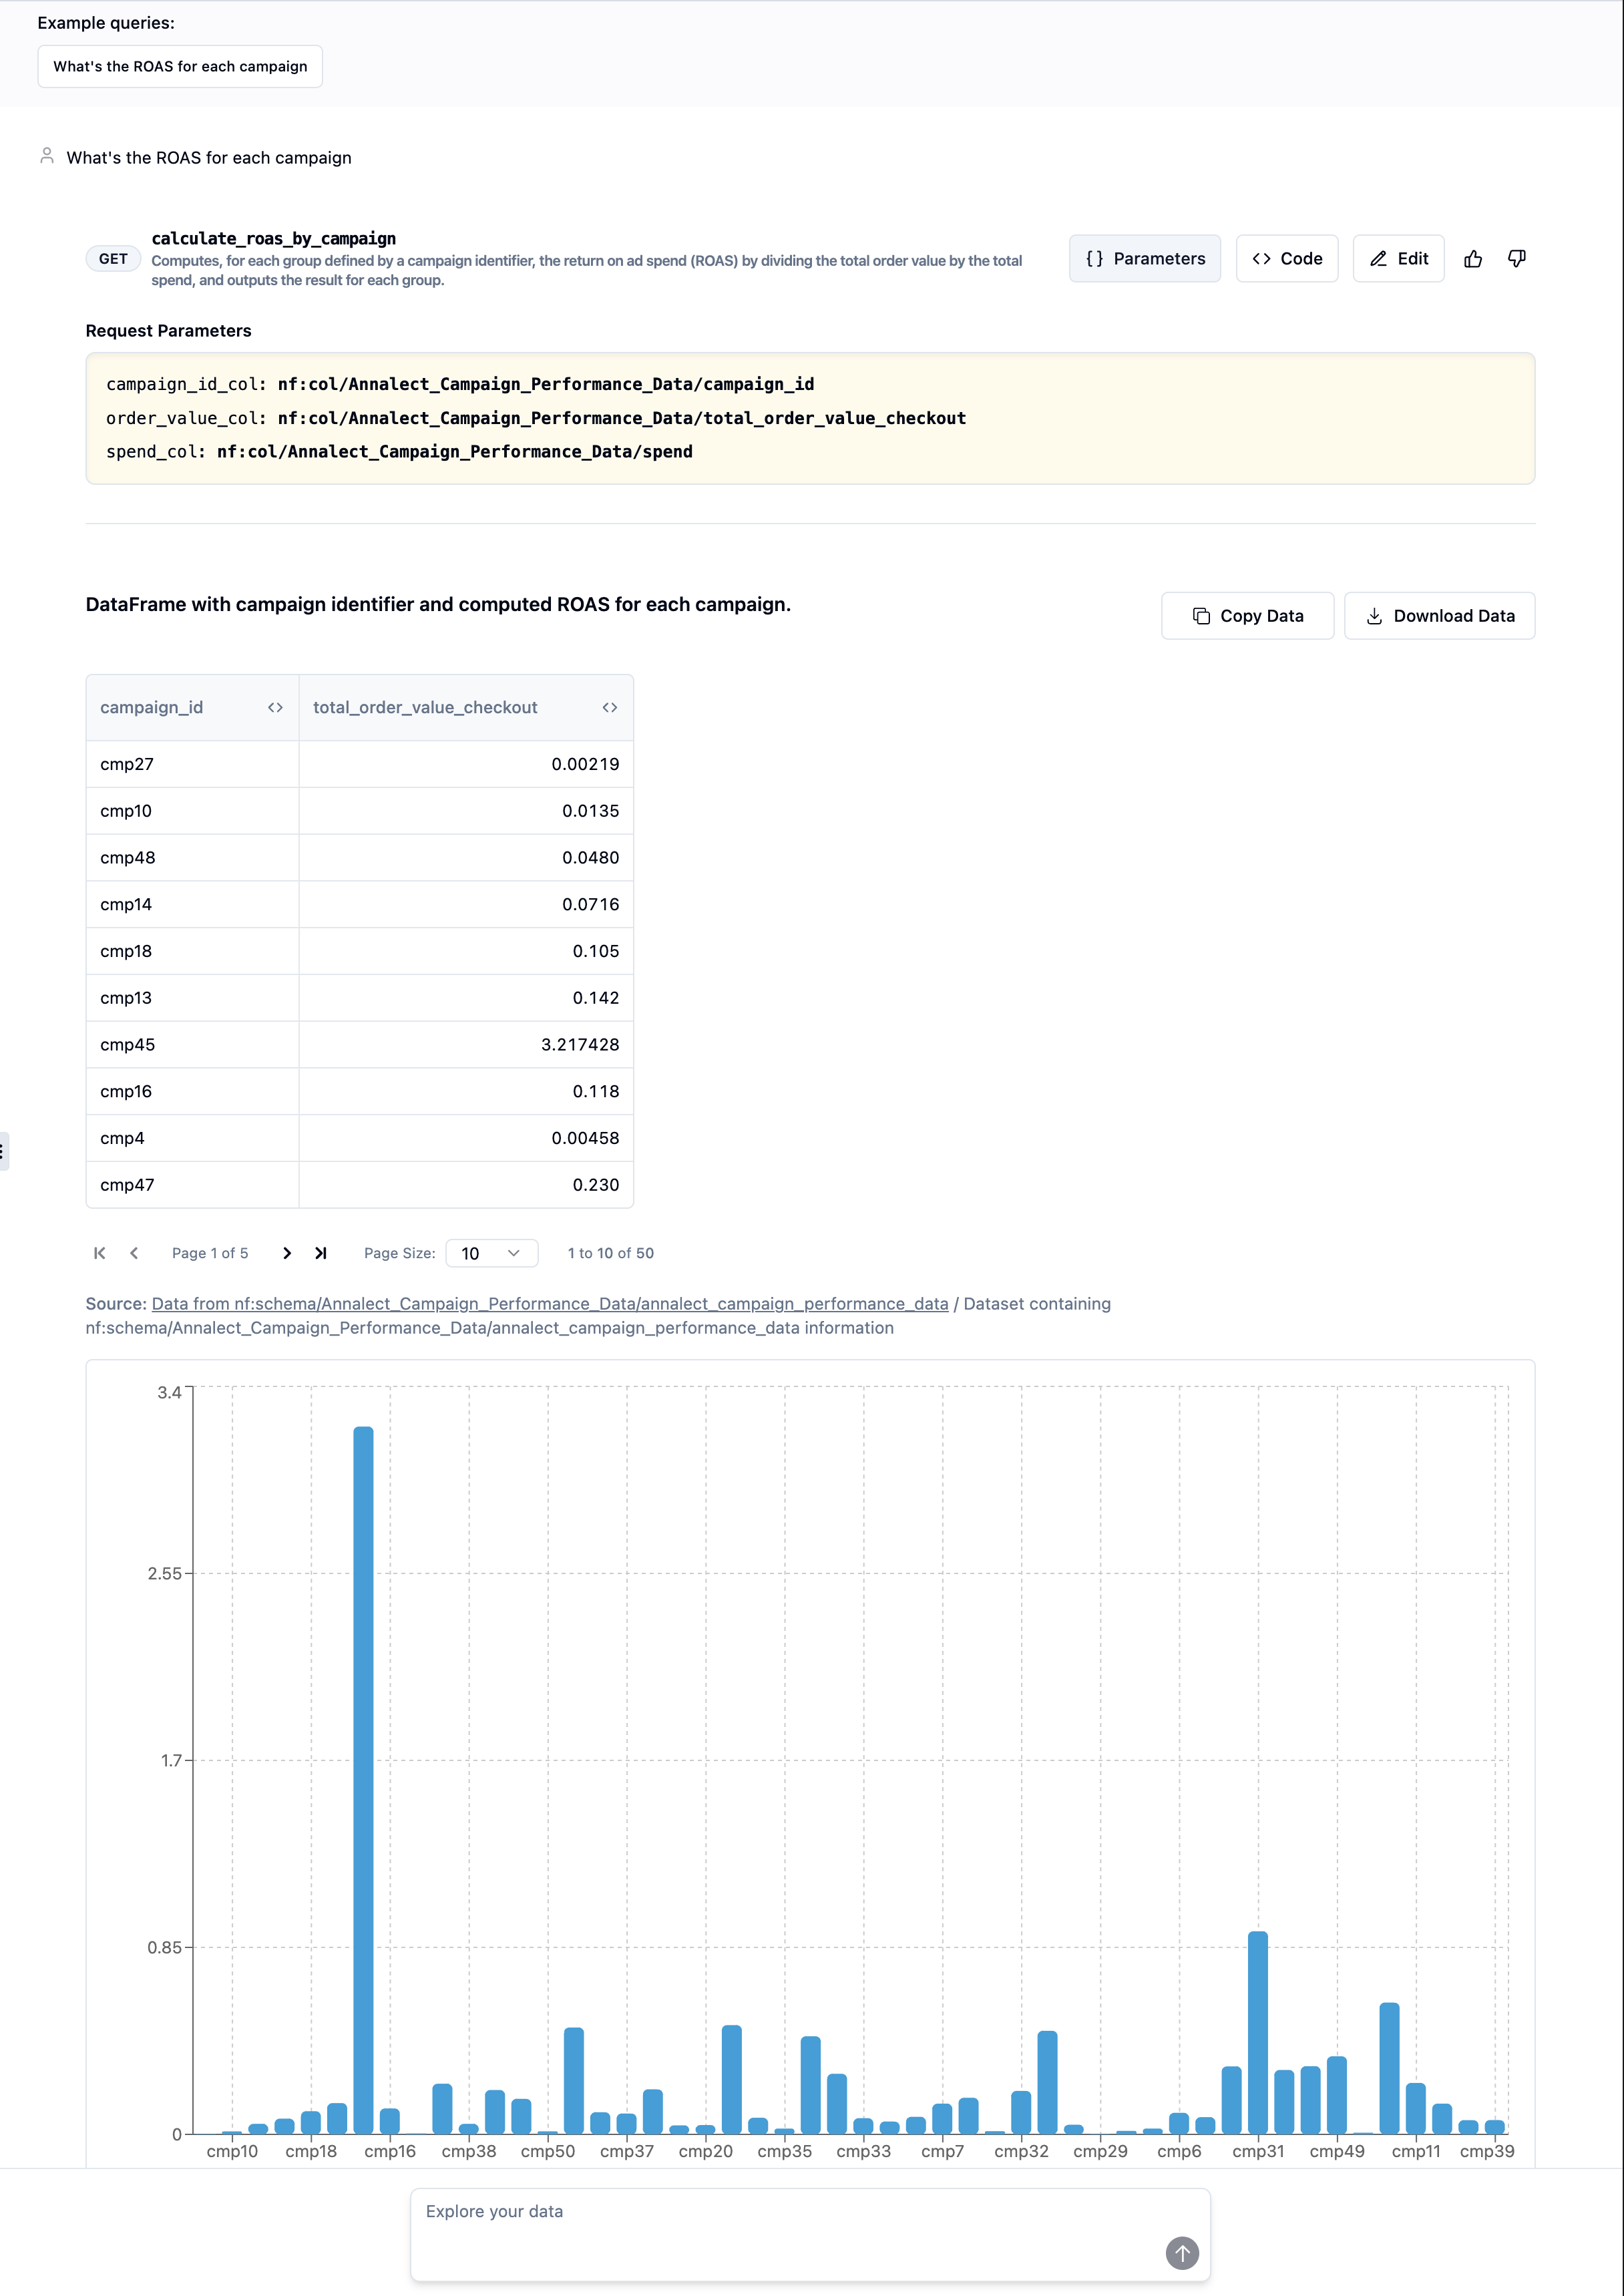
- Type in the chat interface: “What’s the average closing price for each stock?”
- Press Enter or click send
- The system uses your deployed query programs to fetch and visualize the data
Natural language query returns interactive visualizations
- Charts: Bar charts, line graphs, or pie charts based on your data
- Tables: Detailed tabular view of the results
- Interactive Elements: Click, hover, and filter capabilities
- Export Options: Download data or visualizations
3
Understanding the Visualizations
The Explorer automatically chooses the best visualization for your data:Each visualization is interactive:
Bar Charts
For comparing categories like stock tickers, sectors, or price ranges
Line Charts
For trends over time like daily prices or volume changes
Tables
For detailed data with multiple metrics per row
Pie Charts
For showing proportions like market cap distribution
- Click to filter or drill down
- Hover to see detailed tooltips
- Export data as CSV or image
- Resize or fullscreen view
4
Advanced Explorer Features
The Explorer offers powerful capabilities beyond basic questions:
- Follow-up Questions
- Complex Analysis
- Export Options
After getting results, refine your analysis:
How the Explore Interface Works
The Explore interface uses your deployed query programs as its knowledge base. When you ask a question, it:
- Understands your natural language query
- Selects the appropriate deployed query program(s)
- Fetches the data using your APIs
- Automatically creates the best visualization
- Displays interactive results
Integration with Your Applications
Now that you’ve seen the full capabilities, here are common integration patterns:Dashboard Integration
Chatbot Integration
Best Practices
Cache Responses
Store frequently requested data to reduce API calls
Handle Errors
Implement proper error handling and fallbacks
Rate Limiting
Respect API limits and implement backoff strategies
Monitor Usage
Track API usage through the logs dashboard
Next Steps
Congratulations! You’ve completed the quickstart and have:- ✅ Connected your data source
- ✅ Built intelligent queries
- ✅ Deployed production APIs
- ✅ Explored interactive visualizations
Connect More Data
Learn about connecting different data sources and databases
Advanced Queries
Build more complex queries with multiple data sources
API Reference
Explore the complete API documentation
SDK Documentation
Use our SDKs for Python, TypeScript, and more
You Did It! 🎉 In just 10 minutes, you’ve gone from raw data to production APIs with visualization. Welcome to the Infactory community!